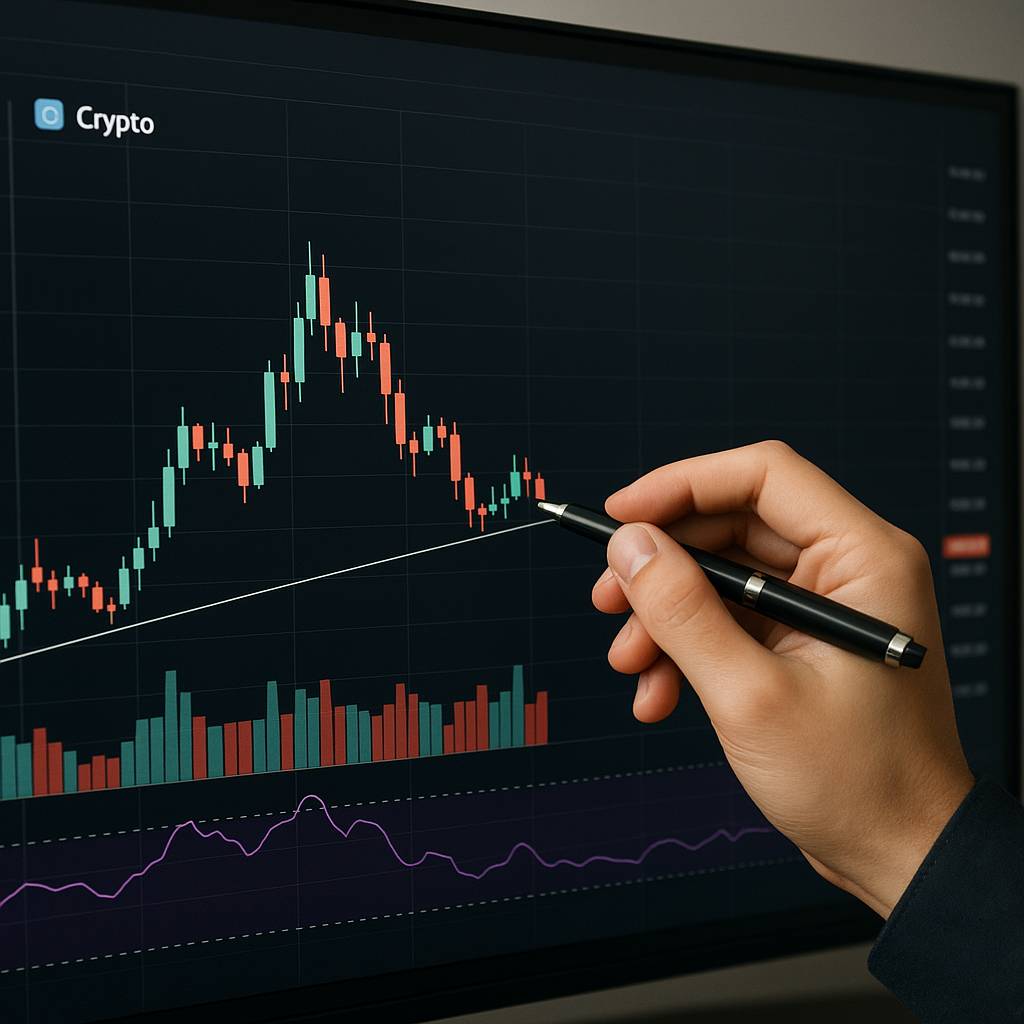
Navigating the world of digital assets demands a solid grasp of price movements and market sentiment. Crypto charts serve as an indispensable tool for traders and investors who aim to decode patterns, measure momentum, and anticipate potential turning points. Mastering these visual guides involves understanding various chart formats, analytical indicators, and the human factors that drive market behavior. This article delves into the core elements of chart interpretation, essential tools for technical analysis, psychological dynamics, and best practices to sharpen your decision-making.
Understanding Chart Types
The first step in chart analysis is selecting the right format. Each chart type conveys information differently, and recognizing their strengths allows for a more comprehensive evaluation of price action.
Line Charts
Line charts connect closing prices over time, producing a simple visual trend line. They offer a clear overview but lack detail on intraday highs and lows. For long-term investors focusing on overarching trends, line charts highlight volatility phases and trend direction without clutter.
Bar Charts
Bar charts display opening, high, low, and closing (OHLC) data for each period. The ability to see the full range of trading activity makes them valuable for identifying intraday or intra-week fluctuations. When a bar’s close is above its open, it often indicates buying pressure; below, selling pressure. These nuances reveal short-term shifts in market sentiment.
Candlestick Charts
Candlesticks represent the same OHLC information as bar charts but in a more visual manner. Each “candle” has a body and wicks (shadows). Bullish candles typically show a close above the open, while bearish candles reflect the opposite. Recognizing individual patterns—such as hammers, dojis, and engulfing formations—can signal potential reversals or continuations in price action.
- Hammer and Hanging Man: Indicate possible reversals at support or resistance.
- Engulfing Patterns: A strong sign that trend direction may change.
- Doji: Reflects market indecision, often preceding a sharp move.
Key Analytical Tools
Once familiar with chart types, traders employ various technical indicators to measure momentum, trend strength, and overbought or oversold conditions.
Moving Averages
Moving averages smooth price data to reveal underlying direction. Common variants include the Simple Moving Average (SMA) and Exponential Moving Average (EMA). A 50-period SMA may capture medium-term trends, while a 200-period SMA highlights long-term movement. Crossovers—when a shorter MA moves above or below a longer MA—often signal buy or sell opportunities.
Relative Strength Index (RSI)
The RSI measures the speed and change of price movements on a scale from 0 to 100. Values above 70 typically indicate overbought conditions, while readings below 30 suggest oversold levels. Divergences between price and RSI can hint at weakening trend momentum before significant reversals occur.
Bollinger Bands
Bollinger Bands consist of a moving average flanked by two standard deviation lines. When price touches the upper band, it may signal overextension; nearing the lower band can suggest a bounce. Periods of contraction (narrow bands) often precede explosive moves.
Volume Profile and On-Balance Volume
Volume analysis validates price moves. A breakout on low volume may lack sustainability, whereas high volume often confirms the strength of a trend. On-Balance Volume (OBV) accumulates volume based on price direction, helping identify hidden buying or selling pressure.
Trendlines, Support, and Resistance
Drawing trendlines connects swing highs in a downtrend or swing lows in an uptrend, outlining the channel in which price travels. Horizontal lines at past turning points represent support and resistance. Breakouts above resistance or breakdowns below support can trigger sizable moves as traders adjust positions.
Psychological Factors and Risk Management
Technical mastery must be paired with emotional discipline. Recognizing cognitive biases and implementing robust risk controls helps preserve capital when markets become unpredictable.
Fear and Greed Cycles
Market sentiment often oscillates between fear and greed. During extended rallies, traders may ignore warning signs, driven by the psychology of missing out. Conversely, panic selling can occur when prices drop sharply. Using tools like the Fear & Greed Index can offer perspective on prevailing emotions.
Position Sizing and Stop-Loss Orders
Effective risk management limits losses without stifling potential gains. Traders commonly risk a fixed percentage of their capital on each trade. Placing a stop-loss order below a key support level ensures automatic exit if price moves against the position. Trailing stops capture profits as a trade moves favorably.
Trade Journals and Discipline
Maintaining a detailed record of entries, exits, position sizes, and rationale fosters accountability. Reviewing past wins and losses reveals recurring mistakes and strengths. Over time, this practice sharpens analytical skills and reinforces disciplined execution.
Common Mistakes and Best Practices
Even seasoned traders can fall into pitfalls that erode profitability. Awareness of these errors and adherence to proven strategies help maintain consistency.
Overreliance on Single Indicators
No single tool provides a complete picture. Relying solely on RSI or moving averages may generate conflicting signals. Combining multiple indicators and chart patterns affords a more robust analysis. Look for confluence—when different tools align around the same price level or trend direction.
Chasing Hot Tips
Cryptocurrency markets are rife with speculation and rumors. Blindly following unverified information can lead to buying at peaks and selling at troughs. Always corroborate tips with your own chart analysis and ensure risk parameters are in place before committing capital.
Ignoring Market Structure Breaks
Markets rarely move in straight lines. Identifying higher highs and higher lows in an uptrend (or the opposite in a downtrend) is key. A break of this structure often signals a trend reversal or consolidation phase. Adjust position sizing and strategy accordingly when market structure shifts.
Maintaining a Long-Term Perspective
While day trading offers quick profits, it also exposes traders to high volatility and emotional stress. Combining shorter-term tactics with a core long-term portfolio helps balance risk and reward. Allocate only a portion of capital to aggressive strategies, reserving the remainder for assets with strong fundamentals.
- Refine entries with multiple time-frame analysis.
- Wait for confirmation before acting on breakouts.
- Respect stop-loss levels without exception.
- Review and adapt the trading plan regularly.


